tswd-portfolio
| home page | visualizing debt | critique by design | final project I | final project II | final project III |
1. Outline
Include a high-level summary of your project. This should be a couple paragraphs that describe what you’re interested in showing with your final project.
Second-hand Cars Depreciation Rates in the U.S.

1.1. High-level Summary:
Purchasing a second-hand car is a significant decision that involves balancing cost, reliability, and long-term value. One crucial factor that often influences this decision is the depreciation rate of the vehicle—a measure of how quickly a car loses its value over time. This project aims to provide readers, specifically potential second-hand car buyers, with detailed insights into the depreciation rates of various cars in the U.S. market. By analyzing factors such as region, car body styles, brand, and other dimensions, the project seeks to help buyers make informed decisions to maximize their investment.
Through comprehensive data analysis and visualization, we will present rankings and trends that highlight which cars depreciate slower and the fundamental reasons behind these patterns. By understanding the underlying logic of depreciation, readers can gain a competitive edge in the market, ensuring they choose vehicles that offer the best value retention. This project not only delivers direct information but also fosters a deeper understanding of the automotive market dynamics affecting depreciation.
1.2. Project structure:
- Introduction: The Importance of Depreciation in Second-hand Car Purchases
- Overview of the second-hand car market in the U.S.
- Explanation of depreciation and its financial impact.
- Understanding Car Depreciation
- Definition and explanation of depreciation in vehicles.
- Factors affecting depreciation rates (age, mileage, condition, market demand).
- Detailed Depreciation by Different Dimensions
3.1. Depreciation by Car Body Styles
- Presentation of data comparing depreciation rates among sedans, SUVs, trucks, etc.
- Visualizations ranking body styles from slowest to fastest depreciation.
- Discussion on why certain body styles retain value better (e.g., popularity, utility).
3.2. Brand Influence on Depreciation Rates
- Analysis of depreciation rates across various brands.
- Rankings of brands with the best and worst depreciation rates.
- Insights into brand reputation, reliability, and their impact on value retention.
3.3. Regional Variations in Depreciation
- Data showcasing regional differences in depreciation.
- Factors contributing to regional variations (climate, economic conditions, regional preferences).
- Case studies of specific regions with notable depreciation trends.
3.4. Additional Factors Affecting Depreciation (still deciding what other dimensions to include)
- (optional) Impact of fuel types (gasoline, diesel, electric) on depreciation.
- (optional) Effect of technological features and model updates.
- (optional) Role of supply and demand in the used car market.
- Conclusion: Making an Informed Purchase Decision
- Recap of the most significant insights from the analysis.
- Strategies for choosing cars with slower depreciation rates.
- Encouragement for readers to apply these insights in their car-buying journey.
- Final thoughts on staying informed about market trends.
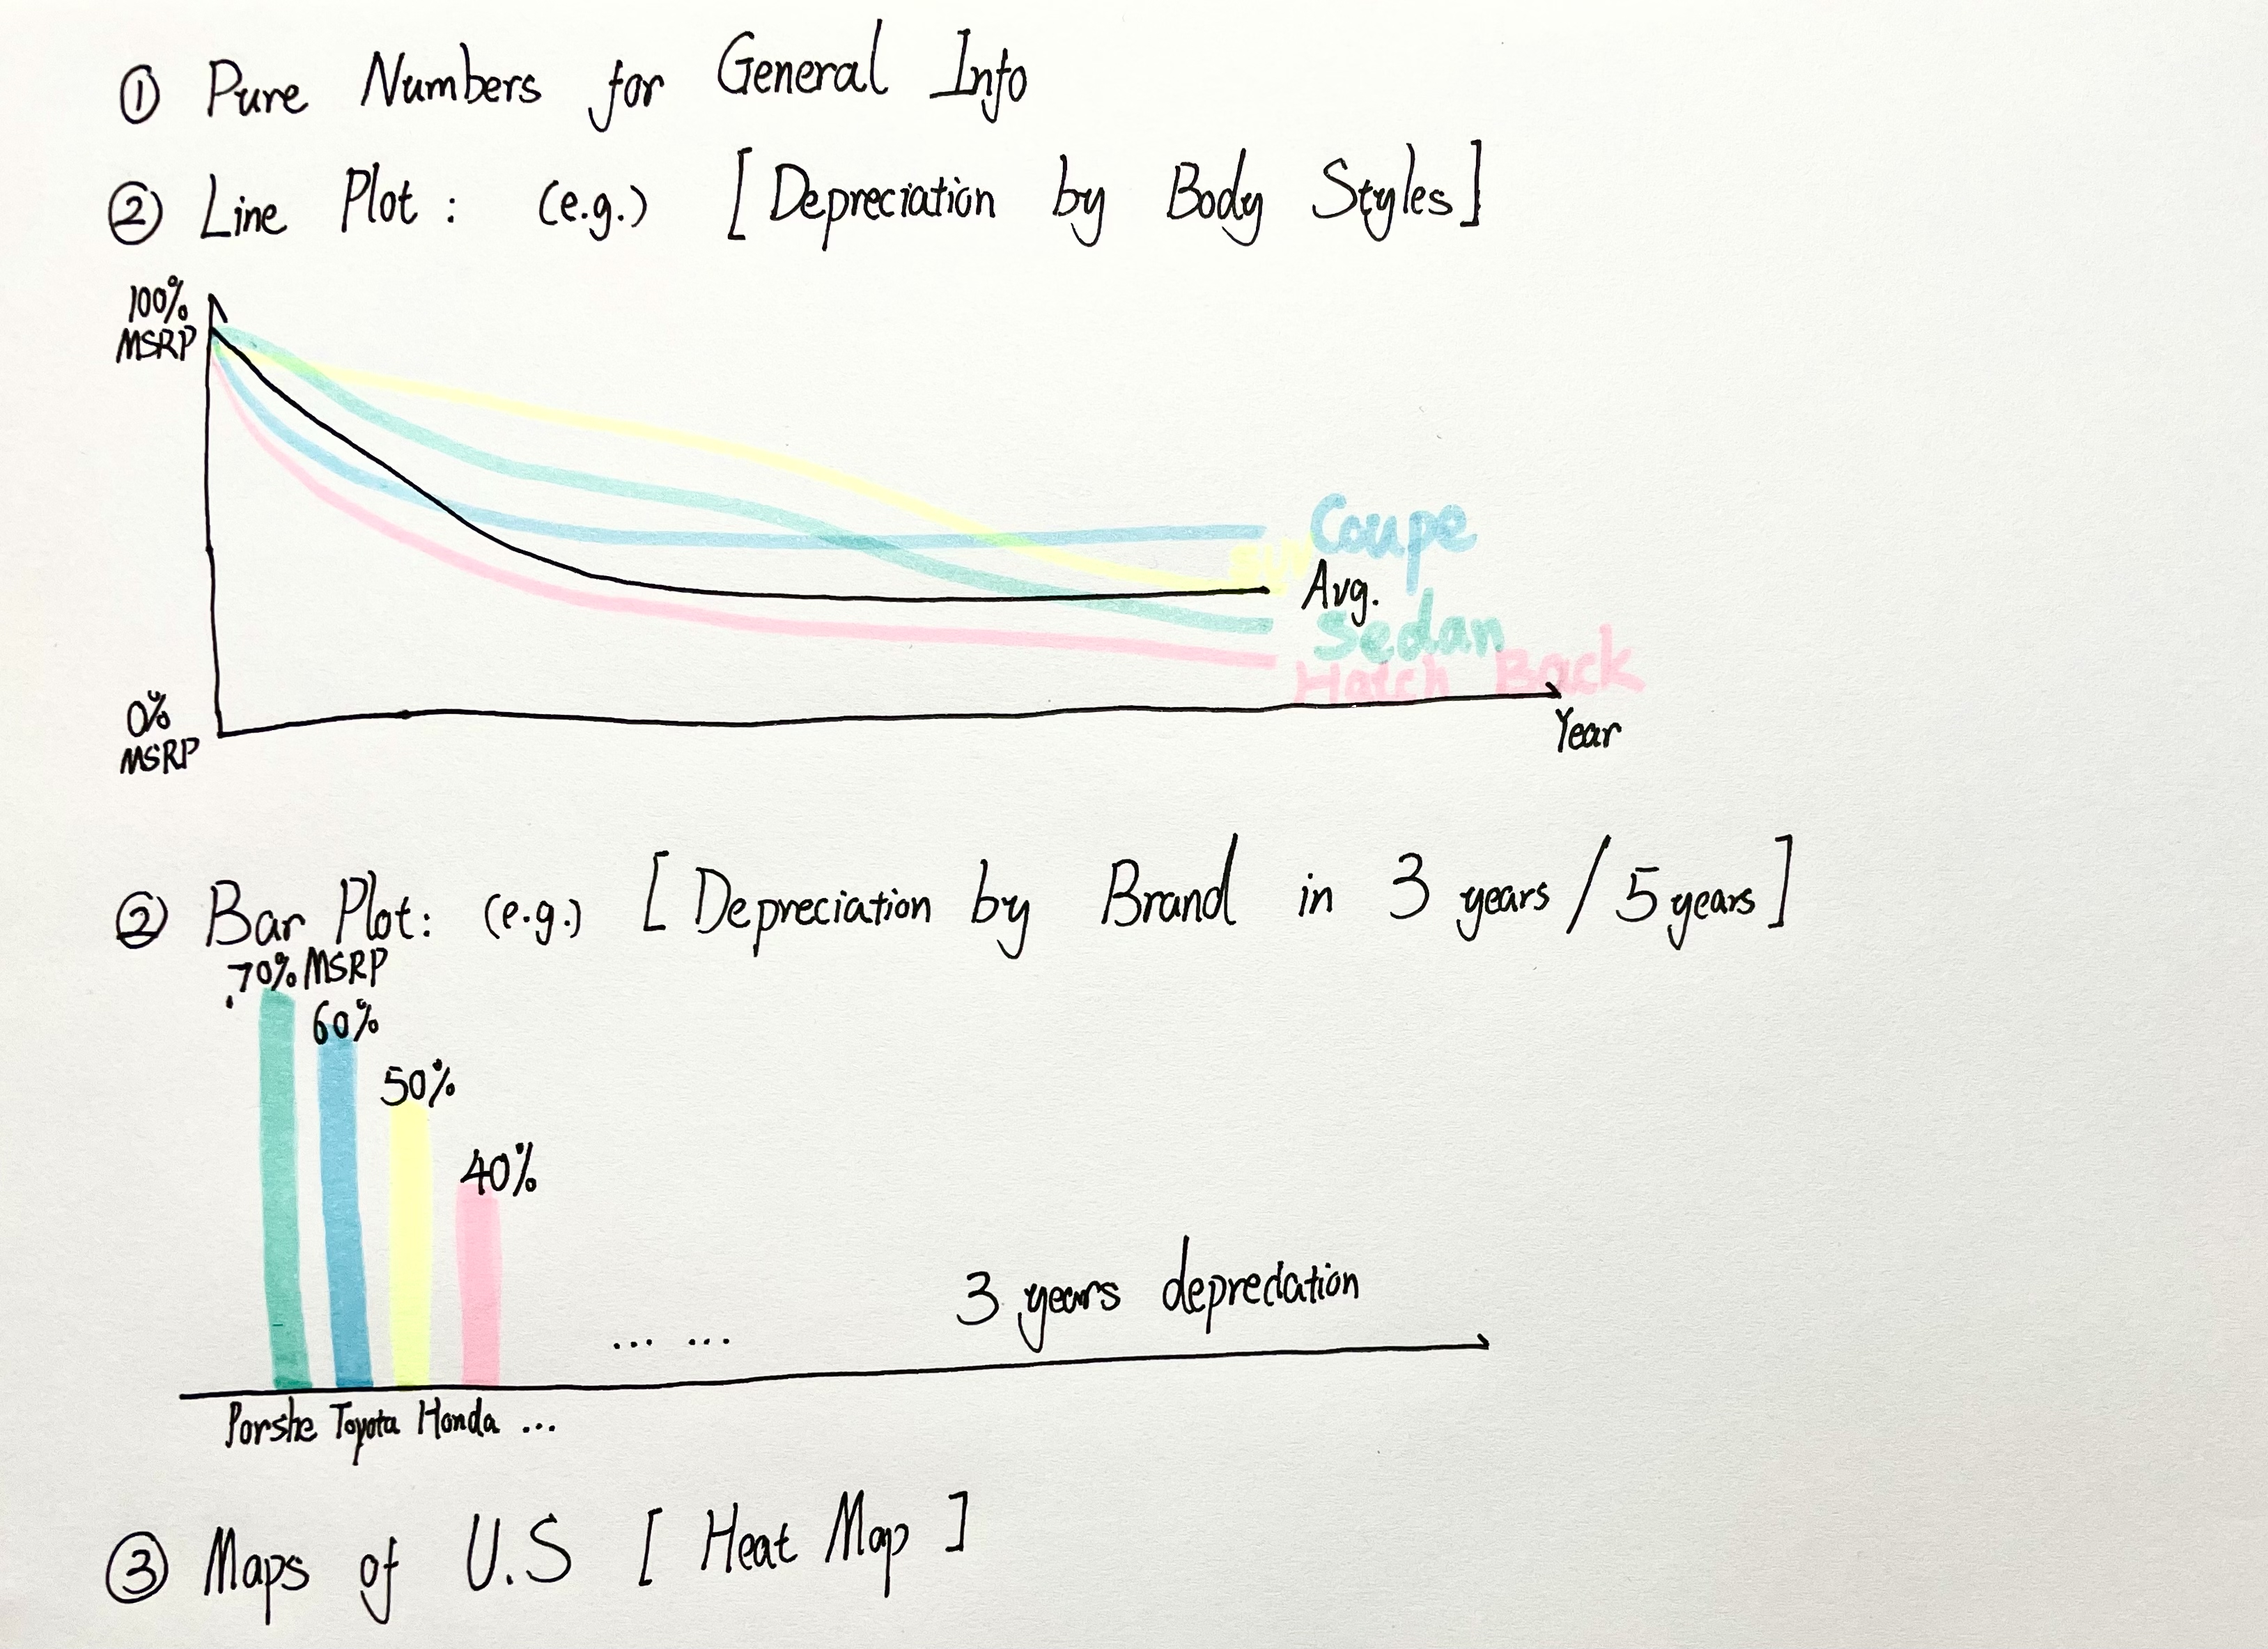
2. Initial sketches
Post images of your anticipated data visualizations (sketches are fine). They should mimic aspects of your outline, and include elements of your story.
3. The data
A couple of paragraphs that document your data source(s), and an explanation of how you plan on using your data.
| Name | URL | Description |
|---|---|---|
| Used Cars Dataset | https://www.kaggle.com/datasets/austinreese/craigslist-carstrucks-data/data | Vehicles listings from Craigslist.org within the United States |
| Used Car Price Prediction Dataset | https://www.kaggle.com/datasets/taeefnajib/used-car-price-prediction-dataset | A collection of automotive information extracted from https://www.cars.com |
| Extended Dataset for Used Car Prices | https://www.kaggle.com/datasets/anthonytherrien/extended-dataset-for-used-car-prices-regression/data | This dataset is an extension designed to complement the “Used Car Price Prediction Dataset” |
| Used Car Price Dataset | https://www.kaggle.com/datasets/rishabhkarn/used-car-dataset | A dataset for predicting used car price |
For this project on second-hand car depreciation rates in the U.S., I will primarily use two datasets:
Used Car Price Prediction Dataset
This dataset is a comprehensive collection of automotive information extracted from cars.com. It includes details on used cars such as make, model, year, mileage, transmission type, fuel type, and current selling price. This rich set of attributes provides a solid foundation for analyzing how various factors affect used car prices.
Extended Dataset for Used Car Prices
This dataset is an extension designed to complement the “Used Car Price Prediction Dataset.” It enriches the original data by adding the manufacturer’s suggested retail price (MSRP) for each vehicle, among other features. The inclusion of MSRP is crucial for calculating depreciation rates, as it represents the original value of the car when new. Planned Use of Data
I plan to leverage these datasets to perform a detailed analysis of car depreciation rates across different dimensions such as car body styles, brands, and regions within the U.S. By comparing the current selling prices with the original MSRP provided in the extended dataset, I will calculate the depreciation percentage for each vehicle. This calculation is essential to understand how much value a car has lost over time, which is a key concern for second-hand car buyers.
Method and medium
In a few sentences, you should document how you plan on completing your final project.
I plan to complete my final project by utilizing Tableau as the primary tool for data analysis and visualization. My project will be an interactive, stand-alone visualization that guides the reader through the story of second-hand car depreciation in the U.S. I will leverage Tableau’s storytelling features to integrate narrative elements with my visualizations.